
Learn More about our other offerings:
Biosearch Technologies Oligo Synthesis
|
Lucigen Reagent Components
|
Rapid Genomics Genotyping Solutions
|
SeraCare
SNPviewer is a tool that enables genotyping data to be viewed as a cluster plot (see below), but that does not include data analysis or reporting functionality. Genotyping data from a service project run at LGC Biosearch Technologies is typically sent to the customer as a SNPviewer file (in addition to a text file). Opening genotyping service project results in SNPviewer will allow you to view the genotyping clusters plate by plate. Genotyping calls cannot be changed within SNPviewer; if you need to be able to edit the calls then you will require our KlusterCaller software.
Your genotyping data may be visualised by downloading the SNPviewer PC tool. This will let you graphically view the clusters that group the allele calls. This software will present your results on a treeview by SNP and master plate. The plates may be clicked on to view the data. Calls can not be changed in SNPviewer. If you need to change any calling then you need KlusterCaller.
SNPviewer 64-bits is suitable for computers that are running on Windows 10 64-bits.
You will need administration rights on your PC to install SNPviewer.
To download our SNPviewer software (free-of-charge) please click here.
This SNPviewer help page covers the following topics:
To open SNPviewer, click on the icon ![]() . Alternatively, select ‘SNPviewer’ and then ‘SNPviewer’ executable from the Start menu of Windows.
. Alternatively, select ‘SNPviewer’ and then ‘SNPviewer’ executable from the Start menu of Windows.
Once SNPviewer opens, you will be prompted to open a genotyping results file. Navigate to the data file (.csv format) that you wish to view, and click ‘OK’.
The data will be imported into SNPviewer.
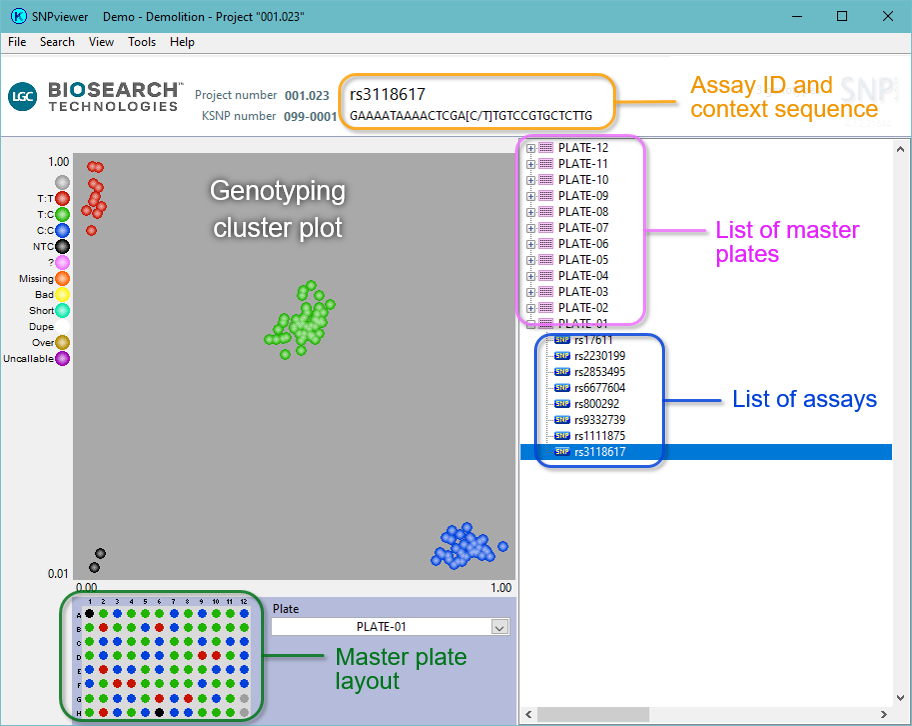
Once your data set has opened within SNPviewer, you will see a similar window to that shown in Figure 1. The DNA master plates and assays used in your project will be displayed in the menu tree on the right hand side of the screen.
Figure 1. SNPviewer window. In the tree on the right hand side, each assay and sample master plate is listed. The cluster plot is displayed by clicking on the relevant plate in the menu tree. Blue data points are homozygous for the allele reported by FAM, green data points are heterozygous and red data points are homozygous for the allele reported by HEX. The black data points represent the no template controls (NTC). The DNA sample plate layout is shown below the cluster plot.
To view the data for a particular assay or DNA plate, navigate to the relevant location within the menu tree and click on the plate / assay to display the genotyping cluster plot.
You can change the order within which the data tree is displayed, Click on ‘View’ in the top menu bar and select ‘View SNP or Plate list options’.
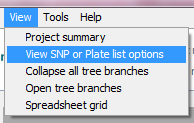
A dialogue box will open with the four available options for viewing data.
Select your preferred option and click ‘OK’.
| Europe, Middle East, and Africa | |
|---|---|
| UK | +44 1992 470 757 |
| Germany | +49 30 1663 54600 |
| North America, Latin America | |
| Wisconsin, USA | +1 888 575 9695 |
| Asia Pacific | |
| China | +8621-22509000 |
| Singapore | +65 6734 4800 |